- ATH: fall back to cached value when fetch fails
- 200D SMA: compute from history.json when CoinGecko blocks us
- Mayer Multiple: derived from 200D SMA fallback
- Drawdown: preserve cached value on ATH fetch failure
- Fixes N/A Drawdown and -- header stats after quick refresh
Bitcoin Accumulation Zone Monitor
On-chain metrics dashboard with historical backtesting for long-term BTC holders. No ML, no black box — pure signal monitoring from proven indicators.
What It Does
Monitors 10 proven Bitcoin on-chain metrics that have historically identified optimal buying zones for long-term holders. Each metric scores 0-10, producing a composite accumulation score of 0-100.
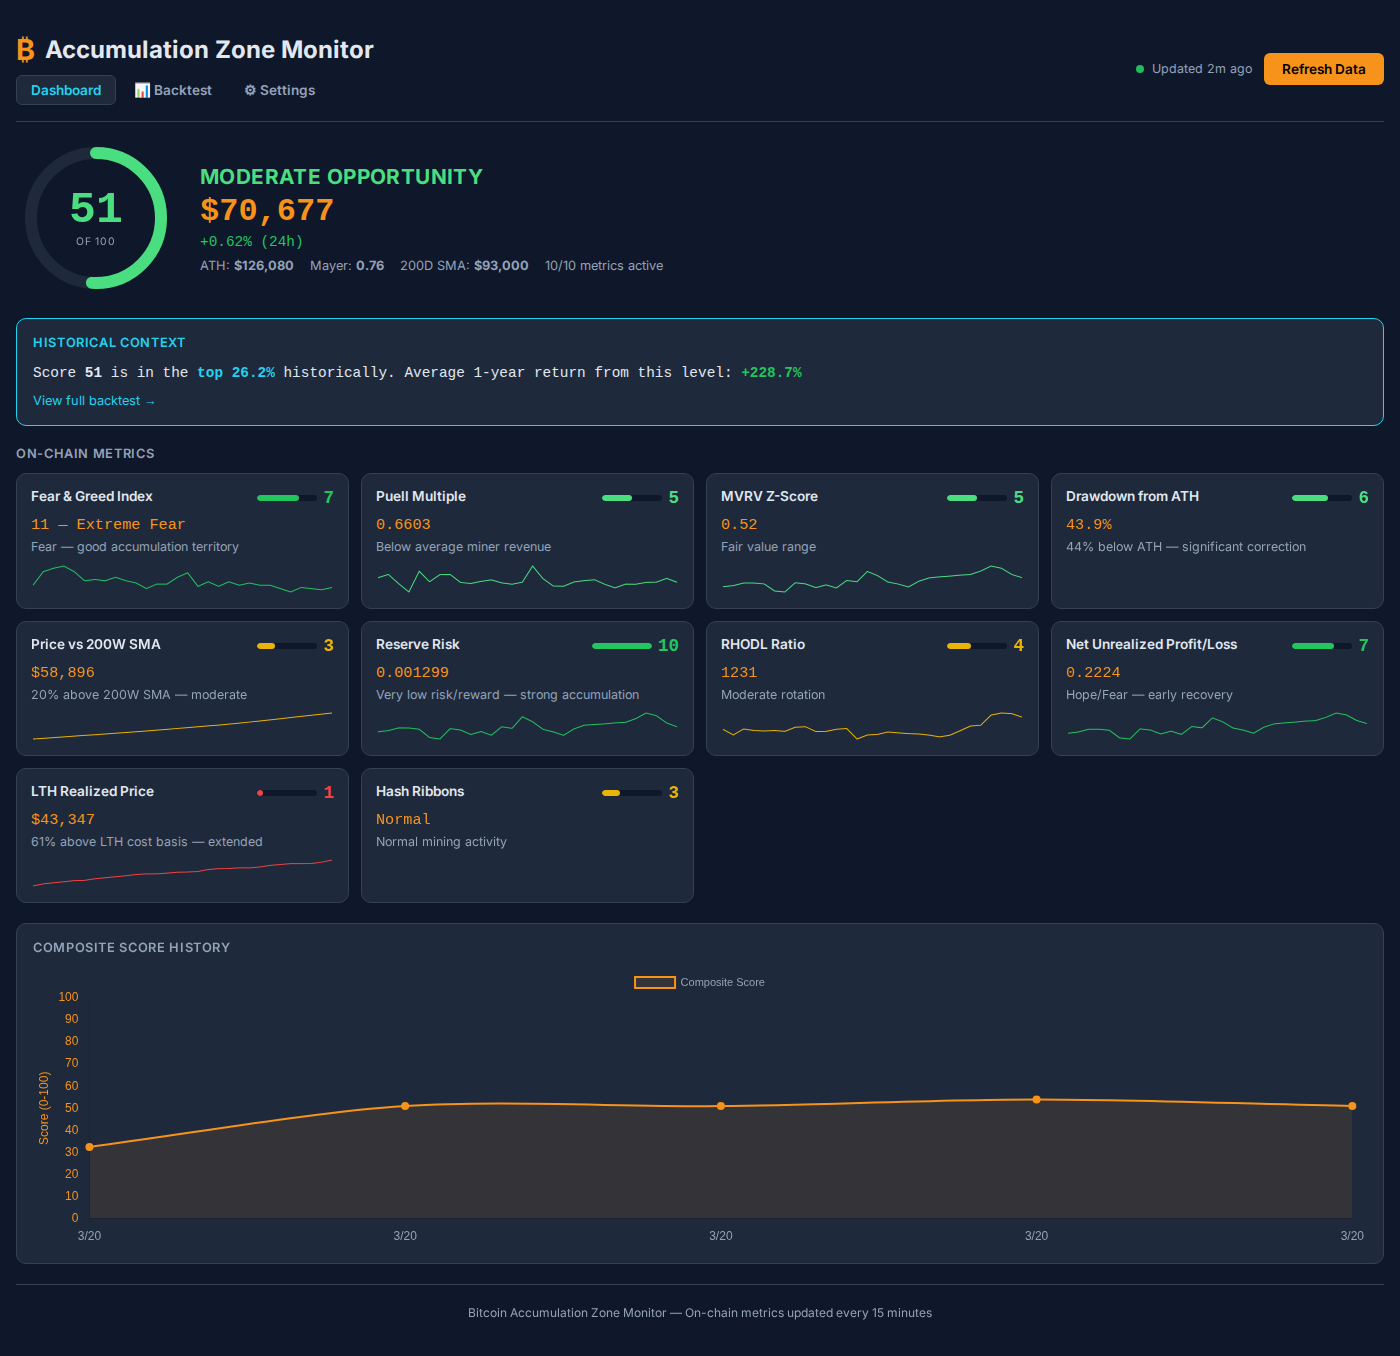
Current reading example: Fear & Greed at 11 (Extreme Fear), MVRV Z-Score at 0.52 (undervalued), Puell Multiple at 0.66 — the kind of conditions that preceded every major BTC rally.
Screenshots
Main Dashboard
Live accumulation score with all 10 metrics, current BTC price, and individual metric breakdowns
Historical Backtest
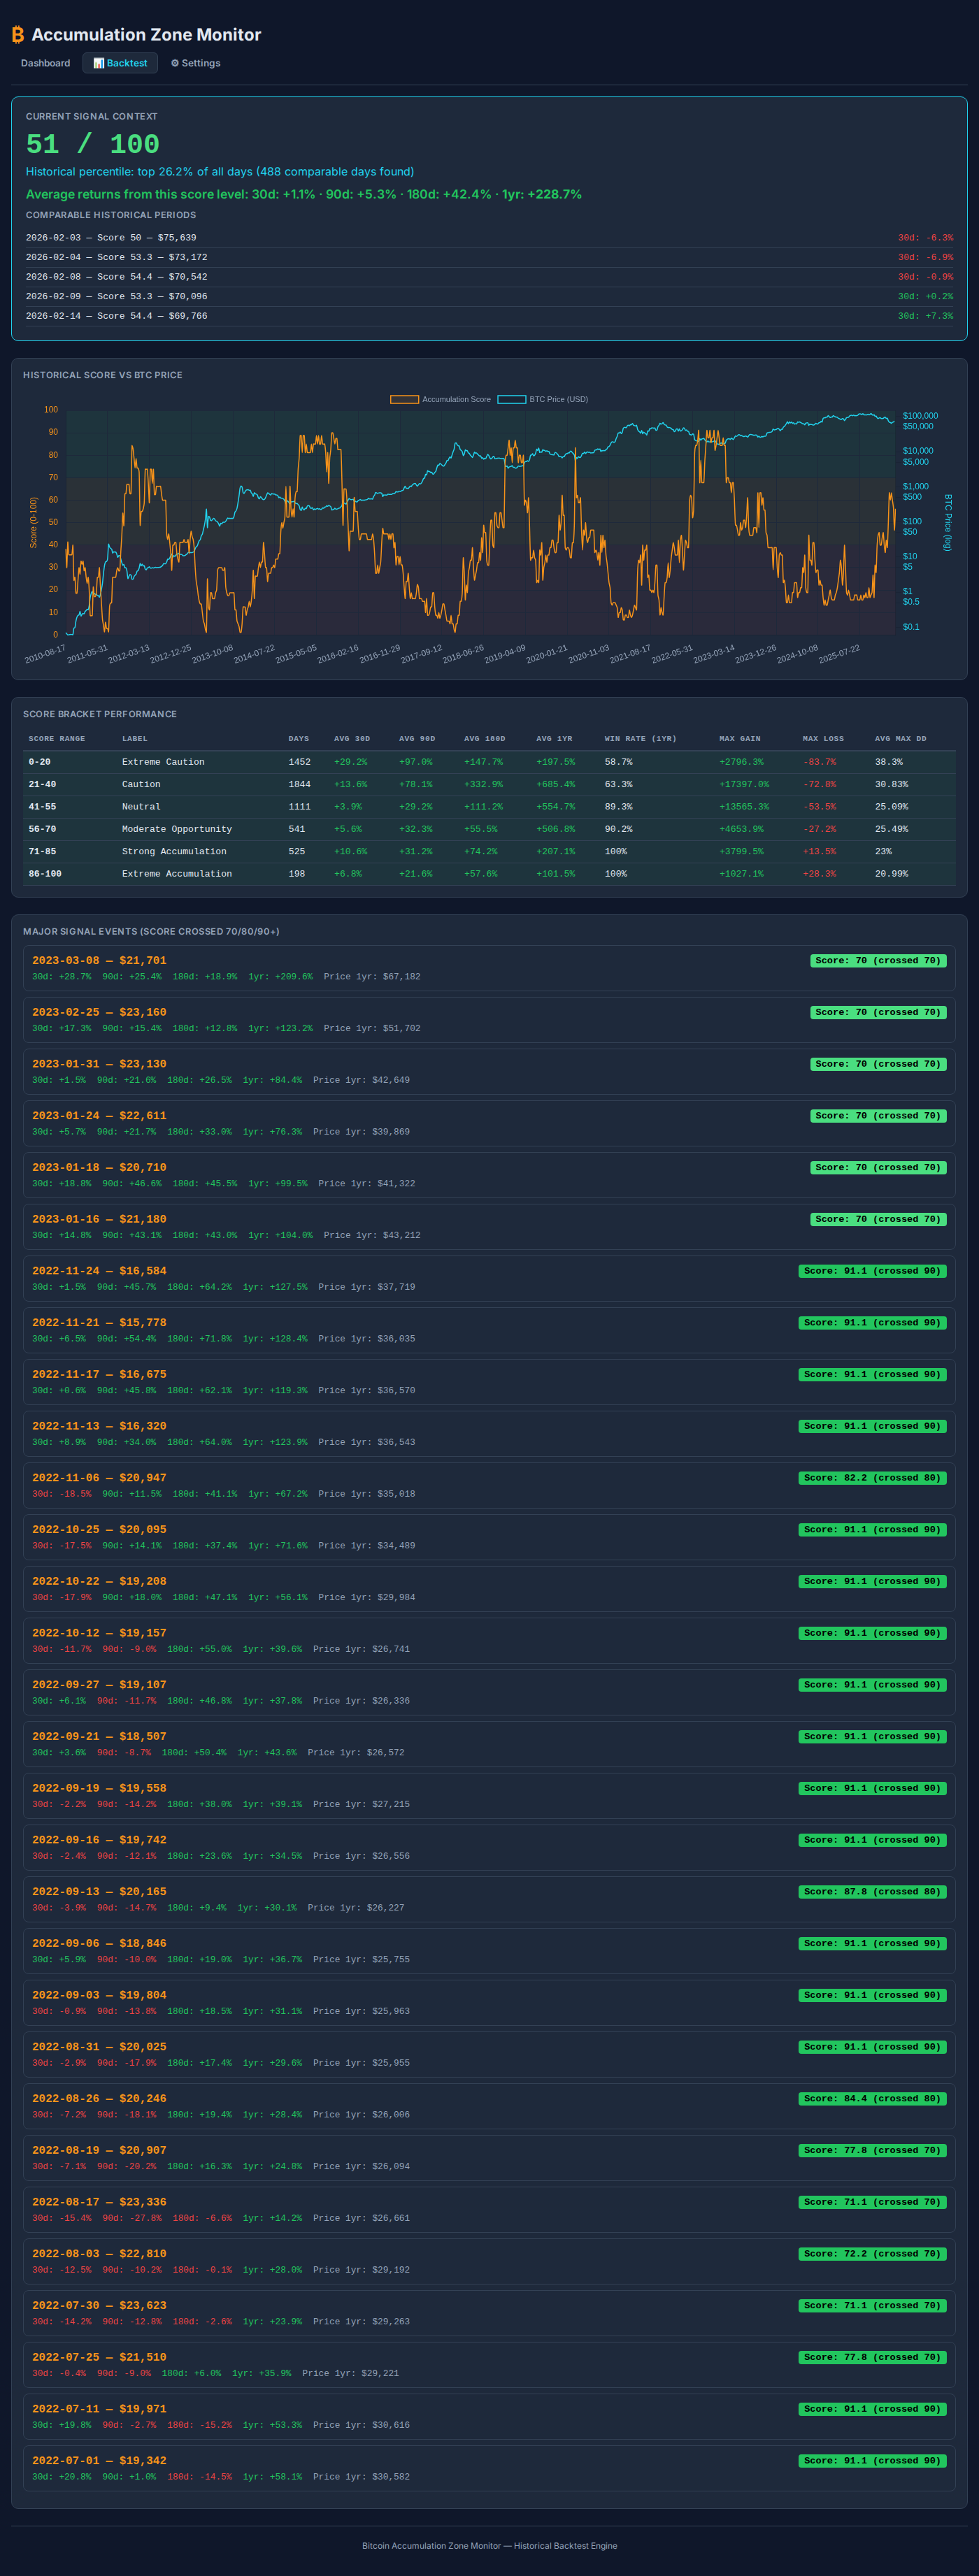 Historical score vs BTC price overlay, score bracket performance table, and major signal events
Settings
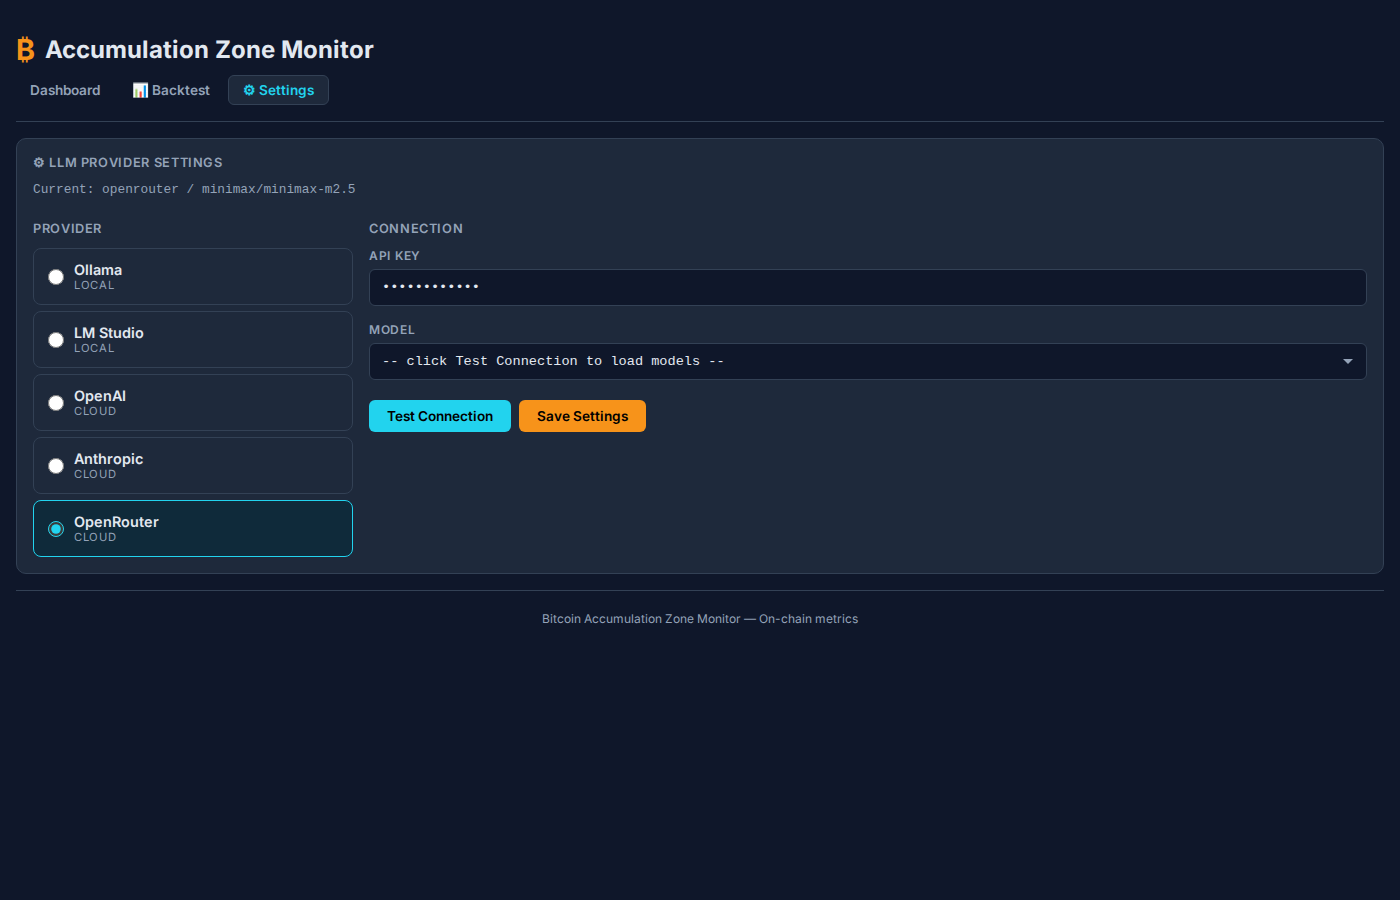 LLM provider configuration for optional AI-powered signal commentary
Metrics
| # | Metric | Source | Accumulation Signal |
|---|---|---|---|
| 1 | Fear & Greed Index | alternative.me API | Extreme Fear (< 10) |
| 2 | Puell Multiple | LookIntoBitcoin (scraped) | Miner capitulation (< 0.5) |
| 3 | MVRV Z-Score | LookIntoBitcoin (scraped) | Below realized value (< 0) |
| 4 | Drawdown from ATH | Calculated | Deep correction (> 50%) |
| 5 | Price vs 200W SMA | LookIntoBitcoin (scraped) | Below 200-week average |
| 6 | Reserve Risk | LookIntoBitcoin (scraped) | High holder confidence (< 0.002) |
| 7 | RHODL Ratio | LookIntoBitcoin (scraped) | Long-term holder dominance (< 100) |
| 8 | NUPL | LookIntoBitcoin (scraped) | Market capitulation (< 0) |
| 9 | LTH Realized Price | LookIntoBitcoin (scraped) | Price below LTH cost basis |
| 10 | Hash Ribbons | LookIntoBitcoin (scraped) | Miner capitulation recovery |
Score Interpretation
| Score | Assessment | Historical Outcome |
|---|---|---|
| 85-100 | 🟢 Extreme Accumulation | Rare (~4x per decade). Historically: 200%+ 1yr returns |
| 70-84 | 🟢 Strong Accumulation | Excellent long-term entry point |
| 55-69 | 🟡 Moderate Opportunity | Decent entry, DCA appropriate |
| 40-54 | 🟡 Neutral | Hold — not compelling either way |
| 25-39 | 🔴 Caution | Market heating up |
| 0-24 | 🔴 Extreme Caution | Historically worst times to buy |
Tech Stack
| Component | Technology |
|---|---|
| Backend | Python 3.13 + FastAPI |
| Frontend | Inline HTML/CSS/JS (dark trading terminal theme) |
| Charts | Chart.js |
| Scraping | Playwright (headless Chromium) |
| Data APIs | alternative.me (F&G), CoinGecko (price) |
| Process Manager | pm2 |
| Port | 3088 |
How Data Is Collected
All data is scraped from free, public sources — no API keys required.
LookIntoBitcoin charts use Plotly Dash. We intercept the chart data XHR response which contains full historical time series (5000+ points back to 2010). The scraper runs every 15 minutes for live data and weekly for full historical updates.
Project Structure
├── dashboard/
│   └── server.py              # FastAPI server + inline dashboard HTML
├── scrapers/
│   ├── lookintobitcoin.py     # Playwright scraper for on-chain charts
│   ├── history_collector.py   # Full historical data collection
│   ├── fear_greed.py          # Fear & Greed Index API
│   └── price.py               # BTC price API
├── scoring/
│   └── engine.py              # Metric scoring logic (0-10 per metric)
├── backtesting/
│   └── engine.py              # Historical backtest engine
├── data/
│   ├── cache.json             # Live metric cache (auto-generated)
│   └── history.json           # Historical data (auto-generated)
├── config/
│   └── thresholds.json        # Scoring thresholds (customizable)
├── screenshots/               # Dashboard screenshots
├── ARCHITECTURE.md            # Detailed architecture & scoring logic
└── README.md
Running
# Install dependencies
pip install fastapi uvicorn playwright requests

# Install Playwright browsers (first time only)
playwright install chromium

# Start the dashboard
cd /opt/apps/btc-ml-optimizer
python3 -m uvicorn dashboard.server:app --host 0.0.0.0 --port 3088

# Or with pm2
pm2 start "python3 -m uvicorn dashboard.server:app --host 0.0.0.0 --port 3088" --name btc-ml-optimizer
First Run
- Visit
http://localhost:3088— the dashboard will auto-scrape current metrics - Visit
http://localhost:3088/backtest— triggers historical data collection (takes ~5 min first time) - Data auto-refreshes every 15 minutes after initial scrape
Backtest Methodology
The backtest engine reconstructs the composite score for every historical day and compares against actual BTC forward returns.
Key feature: Recency weighting — Bitcoin's cycle returns diminish over time (100x → 30x → 8x → 3-4x). The backtest weights recent cycles more heavily:
- 2022-present: 4x weight
- 2020-2021: 3x weight
- 2018-2019: 2x weight
- Pre-2018: 1x weight
Results are shown per-cycle so you see realistic expectations for the current cycle, not averages inflated by early moonshots.
Architecture
See ARCHITECTURE.md for detailed documentation of every metric's scoring logic, data pipeline, and backtest methodology.
License
Private — not for public distribution.